British pig industry in need of quicker escalator
Each year, the InterPig network releases updated figures comparing costs of production of a selection of major pig producing countries and regions around the world. It is interesting to zoom in a little bit further and see where Great Britain* in particular could improve on the basis of the InterPig analysis.
The data network aims to compile and publish internationally comparable data for pig production. Wageningen Economic Research, part of Wageningen University & Research in the Netherlands, has produced a report using the latest (2022) data. In that report, the analysts highlight the position of the Netherlands and discuss costs of production for all the countries surveyed.
Comparisons of the technical data
This article presents comparisons of the technical data and its focus is mainly on the United Kingdom. The data are comprehensive and cover costs of production and technical key performance indicators (KPIs). However, unless presented in index form, the cost comparisons are potentially misleading because of exchange rate effects (although that is clearly not an issue for currencies within the eurozone).
More importantly, the cost of production data offer relatively little insight into underlying productivity – how farmers in different countries are performing on the key technical metrics that farmers work with daily. Those KPIs are a useful way of understanding how one country’s national pig sector is performing across space and through time and this is our focus here.
Costs of production and other KPIs
The latest data set from 2022 for 17 countries and regions (17 countries, 2 regions in Brazil, and 2 systems in Great Britain – outdoor and indoor) covers the cost of pig production and various technical KPIs. The first 3 figures in this article use data for 12 countries, using the Mato Grosso region for Brazil and the indoor system for Great Britain (which actually overstates the average performance of pigs weaned in Great Britain by about 7-10%, due to the prevalence in Britain of the lower productivity outdoor system).
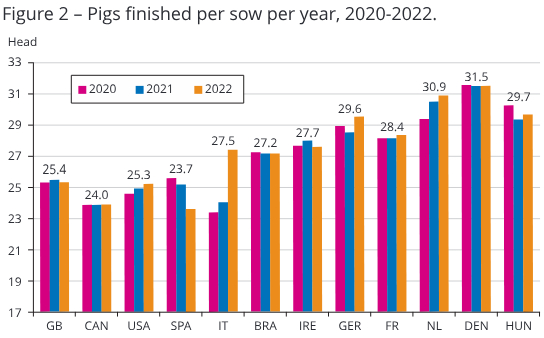
Three KPIs are considered here and are represented in Figures 1-3:
- pigs weaned/sow/year;
- pigs finished/sow/year; and
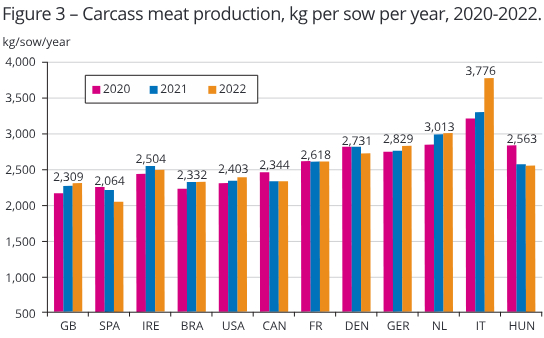
- carcass meat production/sow/year.
Those technical KPIs data can be used to construct a global ranking of pig production efficiency i.e. a “global league table” of technical efficiency. Effectively, those KPIs allow comparison of the technical productivity of the pig producers’ breeding sows in different countries and regions, i.e. how well is the producer using the farm’s key investment asset in the production unit. When key costs of production like feed and energy are also considered, the data provide a direct indication of which producers are more or less competitive in terms of on-farm costs.
It is undeniable that the KPIs and the productivity growth that they imply will largely determine an individual farmer’s (and nation’s) future in pig production.

British producer not in the Premier League
For the British pig industry, the evidence of the InterPig data is that, for the KPIs selected, the British producer is not in the premier league. Indeed, British producers seem to be stuck in the relegation zone – as Figures 4 and 5 show. Figures 1-3 show that the gap between British pig farmers and European competition is, over the most recent 3 -year period, significant.
Crucially, the figure for carcass meat production is, literally, the bottom line. The sow’s primary purpose on the producer’s unit is to produce the maximum amount of saleable meat. And on this measure, the British producer scores poorly in relation to most other countries with an output per sow in Britain that is around 20% less than the average for sows in Germany, the Netherlands and Denmark.
British producers have, however, improved this metric in recent years and this should be acknowledged. Nevertheless, according to the InterPig data, British producers are producing the same amount of meat per sow as those in Brazil, Canada and the USA, but they will have significantly higher feed and energy costs than those three competitors. Those differences in performance between nearby and faraway competitors cannot be ignored. Carcass meat production is the key driver for revenue generated per sow and if British producers cannot improve that KPI, it’s hard to see how they can compete on the world stage.
Decline in carcass meat production
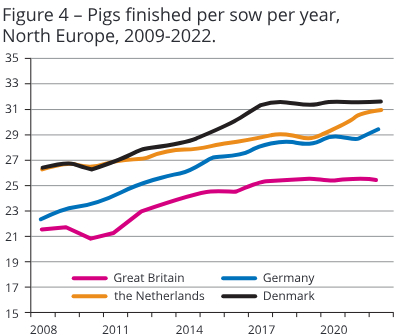
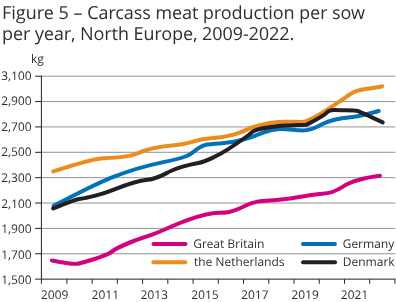
Other aspects of the InterPig data that are worthy of note include the decline in carcass meat production in the Danish pig sector in recent years. What is driving this? Also noteworthy is the recent increase in number of pigs finished per year in the Dutch industry. Germany’s producers also seem to be catching up with Danish levels of productivity on the farm too. Those points, and the relatively poor performance of the British pig sector, are illustrated in Figures 4 and 5. The figures present the levels of productivity for pigs finished per sow per year and carcass meat production per sow per year as a time series.
Thus, it is visible how productivity has improved right across the pig sectors of northern Europe and over time – and in Great Britain.
No change in relative position
However, it is also noticeable that, just as if all these producers were each standing on moving escalators, the relative position of all of them has hardly changed. Denmark leads the way on the metrics of the sow barn but is being challenged strongly by the Netherlands in the finishing units
When carcass meat production per sow per year is considered, the Netherlands now lead the field (accepting that Italy with their specialised very heavy pigs are not a valid comparison with the typical commercial production systems elsewhere).
Great Britain, as shown in Figures 4 and 5, are improving their productivity, but not fast enough to catch up with the leading players in Northern Europe. Put simply, if they want to compete, British producers need to find an escalator that moves up at a faster speed.
* This article deliberately speaks of “Great Britain” (and not of the United Kingdom), as in the underlying study, pig production was analysed in England, Scotland and Wales. In other words: the study did not include pig data from Northern Ireland.