Heading towards one method to register antibiotics use
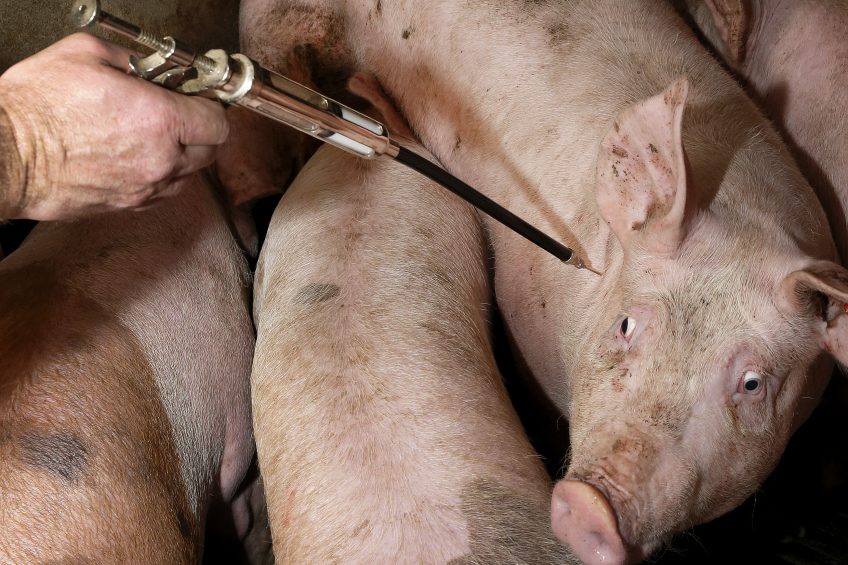
Is it possible to compare antibiotics usage data from one country to another? It takes some calculating, but yes, it is possible. Scientists gathered tonnes of data from Sweden, Belgium, France and Germany to do so. Pig Progress tried to find out who scored best.
For several years now, it has become clear all over the world that antimicrobial resistance is a real threat. Hence, everybody in society, from agriculture to human health, has a responsibility to reduce the amount of antibiotics used as much as possible.
In the pig industry, as in many other industries, the long road towards reducing the usage starts with registering it, analysing the data and on the basis of that, finding out where there are options to curb the usage. In various countries in North Western Europe, at least a start has been made with that process in the last decade. As was discussed in Pig Progress in early 2015, Denmark and the Netherlands both developed a benchmarking system to measure usage, which can even lead to penalising measures should reduction targets not be met. Also Belgium started a similar approach recently.
Figure 1 – Proportion of antimicrobial classes of the total number ofantibiotic treatment incidences per 1,000 pig-days at risk for 227farrow-to-finish pig herds in Belgium, France, Germany and Sweden.

The next question is obvious: which country has proved more successful in its control of antibiotics usage? It’s a question, however, which appears to be more difficult to answer than it seems. The Netherlands and Denmark have developed different data gathering methods as well as calculation models. Although both make good sense, this difference makes comparison of the figures extremely difficult if not impossible. Extrapolating that problem, the absence of a standardised system also means that it will be hard to establish universal regulations which might eventually be applied in the entire European Union or even beyond.
Researchers therefore decided to embark on an ambitious mission. In four countries in Europe (Belgium, Germany, France and Sweden) they gathered and calculated data in a uniform method, to see if they could develop one model to measure antibiotics usage – and then compare.
Time and place
In total 227 farrow-to-finish pig herds participated in the research, which ran between December 2012 and December 2013. Every country participated with 60 herds, with the exception of Belgium, where 47 pig farms participated. The inclusion criterion was that every farm had at least 100 sows and 500 finishing pigs.
Veterinary visits as well as an analysis of records yielded a wide variety of data around antimicrobial consumption in these countries. All data were subsequently quantified using the ABcheck online tool, developed by the University of Ghent. The researchers divided the pig population on-farm into suckling piglets, weaned piglets, finishing pigs and breeding pigs (boars, sows and gilts). In order to reach a uniform calculation method, the introduction of ‘treatment incidences’ (TI) was key. This treatment incidence gives an indication of the number of treatment days in a hypothetical lifespan of 1,000 days or the number treated animals on any particular day in a group of 1,000 animals. How this was calculated, is shown in the box ‘Treatment incidences’.
Interestingly, they also introduced a figure, combining suckling piglets, weaned piglets and finishing pigs in a ‘TI200’, creating a usage figure for a standardised lifespan of 200 days.

Find all there is to know about pig health using Pig Progress’ unique Pig Health Tool
Which country performed best?
There were many ways to compare the outcomes, but when focusing on the TI200 figures, Sweden came out best in the comparison. Median figures for TI200 indicate that Sweden reached a level of 14.3 (the lowest) and Germany a level of 189.0 (the highest). France (94.7) and Belgium (107.8) scored in between. This illustrates that in Sweden a pig from birth until slaughter, is treated 14.3 out of 1,000 days or explained more easily, during 1.43% of its lifespan.
Which antibiotic was used most?
In most countries, the most widely used drug was given to weaner pigs. Figure 1 shows that both in Belgium (37.7%) as well as in Germany (35.7%), the top used antibiotic was aminopenicillins. In France, the most used antibiotic was colistin, including combinations, which took a share of 30.1% of total used antibiotics in pigs. Only in Sweden, the top-used antibiotic was benzylpenicillin, taking up 61.2% of all antibiotics used. This antibiotic is used mostly in suckling piglets.
How were the antibiotics administered?
Interestingly, there appeared to be a striking difference between the method of administering between Belgium, Germany and France on one hand, and Sweden on the other. The oral route (through feed or water) is preferred in Belgium (70%), Germany (71%) and France (87%), whereas this approach is only used in 13% of the cases in Sweden. Alternative methods are preferred there.
International co-operation
In their article, the scientists aim to explain the differences between the countries and they repeatedly emphasise that there sometimes were strong differences between farms. Nevertheless, even more important than looking at the outcomes, is the fact that it has gradually become possible to compare antibiotics usage internationally. That is true international co-operation in its starting phase.
Treatment incidences
The treatment incidence (TI) figure can be calculated according to the formula below. DDDA is short for Defined Daily Doses Animal. In the definition of the World Health Organization (WHO), a Defined Daily Dose is ‘the assumed average maintenance dose per day for a drug used for its main indication’. For the calculation, previously established consensus DDDAs were used; TI calculations were performed for each administered antimicrobial product per age category.

The research was an initiative of a Europe-wide programme called ‘Minapig’, an initiative to evaluate alternative strategies for raising pigs with minimal antibiotic usage. The original article in Preventive Veterinary Medicine was written by ten researchers from Belgium, France, Germany, Sweden and Switzerland. It was published in 2016.


